Draw a diagram with TikZ
Draw a diagram, a commutative diagram or a plot in TikZ, check it in the editor, load packages such as pgfplots, and caption it as a figure.
TikZ is the LaTeX drawing language: geometric constructions, commutative diagrams, graphs, circuits, plots. On LibreTimes you write the TikZ source in the text, and a real LaTeX compiles it into an image when the work is saved, so a diagram looks the way it would in a printed paper. Readers receive the image; nothing is compiled in their browser.
The diagrams on this page were compiled the same way, once, from the source shown in each example's Markdown tab.
Write the diagram
- In the editor, choose Code and put the cursor where the diagram goes.
- Write a line
:::tikz, then thetikzpicture, then a line:::.
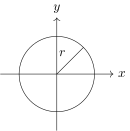
:::tikz
\begin{tikzpicture}
  \draw[->] (-1.5,0) -- (1.5,0) node[right] {$x$};
  \draw[->] (0,-1.5) -- (0,1.5) node[above] {$y$};
  \draw (0,0) circle (1);
  \draw (0,0) -- (45:1) node[midway, above left] {$r$};
\end{tikzpicture}
:::
The body is what you would put between \begin{document} and
\end{document} in a standalone LaTeX file, without those two lines and
without \documentclass: the document around the picture is added for you.
Maths in node labels works as usual, {$x$}, and amsmath and amssymb are
always loaded.
See it drawn
- Switch to Visual. The diagram is compiled and drawn in place of the source.
- If it cannot be compiled, the block shows TikZ failed to render, with LaTeX's message and the line of your source it refers to. Fix that line in Code and switch back.
A failed diagram never stops the text around it from being saved or published. Until it compiles, readers see Diagram not rendered. in its place rather than your source.
Load a package or a library
Common TikZ libraries, such as arrows.meta, calc, positioning and
matrix, are already loaded. A commutative diagram needs nothing more than
matrix:
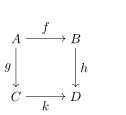
:::tikz
\begin{tikzpicture}
  \matrix (m) [matrix of math nodes, row sep=3em, column sep=3em]
    { A & B \\ C & D \\ };
  \path[->] (m-1-1) edge node[above] {$f$} (m-1-2)
                    edge node[left]  {$g$} (m-2-1)
            (m-1-2) edge node[right] {$h$} (m-2-2)
            (m-2-1) edge node[below] {$k$} (m-2-2);
\end{tikzpicture}
:::
For anything else:
- Put
\usetikzlibrary{…}or\usepackage{…}lines at the top of the block, before\begin{tikzpicture}. - Use the package as you would in LaTeX.
A plot with pgfplots:
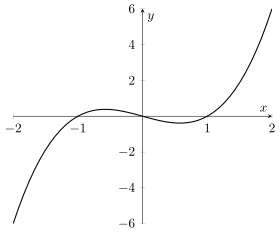
:::tikz
\usepackage{pgfplots}
\begin{tikzpicture}
  \begin{axis}[axis lines=middle, xlabel=$x$, ylabel=$y$, domain=-2:2, samples=50]
    \addplot[thick] {x^3 - x};
  \end{axis}
\end{tikzpicture}
:::
Any TikZ library can be loaded. Packages are a fixed set that has been
installed and checked, including pgfplots, circuitikz, tkz-euclide,
forest, chemfig and tikz-3dplot. A package outside it fails with a
message naming the ones that are available. \input, \include and
anything that reads a file or runs a program are refused, because the diagram
is compiled on a shared machine.
The tikzcd environment of the tikz-cd package does not compile correctly
yet, because the block puts every picture inside a tikzpicture of its own.
Draw commutative diagrams with a matrix, as above. A rectangular one with
straight arrows can also be a formula: KaTeX's \begin{CD} works in a
display.
Caption it as a figure
- Put a line
::::figure{#fig-name}above the:::tikzline, with four colons because the diagram inside has three. - After the closing
:::of the diagram, write the caption. - Close the figure with
::::.
The square commutes: .
::::figure{#fig-square}
:::tikz
\begin{tikzpicture}
  \matrix (m) [matrix of math nodes, row sep=3em, column sep=3em]
    { A & B \\ C & D \\ };
  \path[->] (m-1-1) edge node[above] {$f$} (m-1-2)
                    edge node[left]  {$g$} (m-2-1)
            (m-1-2) edge node[right] {$h$} (m-2-2)
            (m-2-1) edge node[below] {$k$} (m-2-2);
\end{tikzpicture}
:::

The square commutes: $h \circ f = k \circ g$.
::::
Link to it from the text with [the diagram](#fig-square), as for any
figure.
Put a diagram inside a statement
A diagram can sit in a proof, an example or any other block. The outer block needs more colons than the diagram:
Proof. The maps fit into the square
and the claim follows by chasing an element of around it.
::::proof
The maps fit into the square

:::tikz
\begin{tikzpicture}
  \matrix (m) [matrix of math nodes, row sep=3em, column sep=3em]
    { A & B \\ C & D \\ };
  \path[->] (m-1-1) edge node[above] {$f$} (m-1-2)
                    edge node[left]  {$g$} (m-2-1)
            (m-1-2) edge node[right] {$h$} (m-2-2)
            (m-2-1) edge node[below] {$k$} (m-2-2);
\end{tikzpicture}
:::

and the claim follows by chasing an element of $A$ around it.
::::
The result
On the published page the diagram is an image set in the text, drawn in the page's ink colour: dark lines on a light page, light lines on a dark one, from the same compilation. Clicking it opens it full screen with zoom. In a figure, the caption sits under it and a link to the figure's anchor jumps to it.
When something is not right
- A diagram is shown as Diagram not rendered. It has not been compiled yet, or its last compilation failed. Open the work in the editor and look at the block in Visual for the error.
- The diagram is tiny or huge. The image keeps the size TikZ drew it at.
Draw in centimetres at the size you want it read, or use
scale=on thetikzpicture. - You want to show TikZ source as text, as the Markdown tabs on this
page do. Put it in a code block with the language
latex; a code block is never compiled.